-
Title
-
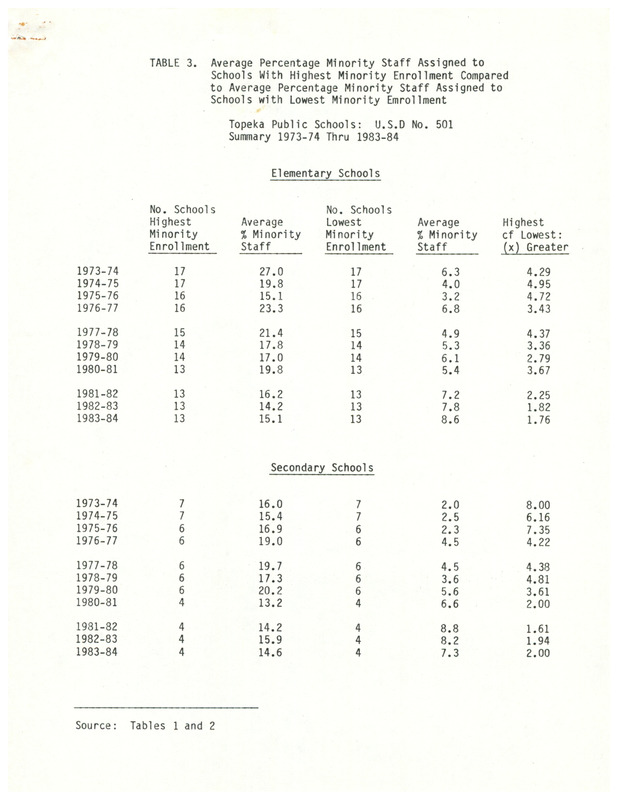
A Table From a Court Document with Charts Comparing Average Percentage of Minority Staff Assigned to Schools With Highest Minority Enrollment Compared to Schools with Lowest in Topeka Schools from 1973-74 School Year to 1983-1984 School Year.
-
Alternative Title
-
Table 3 Average Percentage of Minority Staff Assigned to Schools With Highest Minority Enrollment Compared to Schools with Lowest Minority Enrollment Topeka Public Schools: U.S.D. No. 501 Summary 1973-74 through 1983-84.
-
Date
-
1973--1984
-
Description
-
Case Data and Exhibits for Brown III, a relitigation of Brown v. Topeka Board of Education (1954) that corrected resegregation issues caused by open enrollment school choice in 1992. Charts comparing percentages of minority staff assigned to schools with highest minority enrollment to schools with the lowest in Topeka Schools from 1973 to 1984.
-
Additional Subject
-
American Civil Liberties Union
-
Desegregation
-
Location
-
Topeka
-
Shawnee County
-
Kansas
-
United States
-
Type
-
Textual document
-
Medium
-
Paper
-
Format
-
PDF
-
HBCU Identifier
-
mwchcac.ar.2022.Lam.ID.1.40
-
HCAC Identifier
-
HCAC.JSU.0248
-
Rights
-
All rights held by the Margaret Walker Center. For permission to publish, distribute, or use this image for any other purpose, please contact Margaret Walker Center, Jackson State University, 601-979-3935 Attn: Center Director.
-
Contributing Institution
-
Jackson State University
-
Language
-
English


